- June 4, 2024
- Posted by: Finanalyz
- Category: Uncategorized
In today’s data-driven world, businesses and analysts rely heavily on data analytics to make informed decisions. One crucial aspect of data analytics is understanding and leveraging Time Series Patterns (TSPs). Time series data, which consists of data points recorded at regular intervals, can reveal trends and patterns that are essential for forecasting and strategic planning. Whether you are tracking stock prices, analyzing weather data, or monitoring website traffic, understanding TSPs can provide valuable insights and drive better decision-making.
In this comprehensive blog post, we will delve into the world of time series patterns, exploring their significance, applications, and the various tools and techniques used for analysis. We will also provide practical examples of how TSPs are applied in different industries and discuss how FinAnalyz can help you manage your personal finances more effectively. Join us as we unravel the complexities of TSPs and demonstrate their powerful role in data analytics.
Table of contents:
Introduction to Time Series Patterns (TSPs)
Importance of Time Series Data
Applications of TSPs in Business Analytics
Tools and Techniques for Analyzing TSPs
Case Studies: Practical Uses of TSPs
Leveraging FinAnalyz for Personal Finance Management
Introduction to Time Series Patterns (TSPs)
In the context of data analytics, TSPs (time series patterns) refer to trends or patterns in data that occur over time. Time series data consists of data points recorded at regular intervals, such as stock prices, weather data, or website traffic. Understanding these patterns is crucial for making informed decisions and accurate predictions in various fields. By analyzing TSPs, businesses and analysts can gain insights into historical trends and future projections, which can drive strategic planning and operational efficiency.
Importance of Time Series Data
Time series data is vital for understanding how data evolves over time. This type of data allows analysts to track changes, identify trends, and observe seasonal variations. The ability to analyze time series data helps businesses and organizations make data-driven decisions, forecast future trends, and optimize their operations. For instance, companies can use time series data to predict sales cycles, manage inventory levels, and adjust marketing strategies based on customer behavior trends. In finance, time series analysis is essential for modeling stock prices, interest rates, and economic indicators.
Applications of TSPs in Business Analytics
Sales Forecasting: Businesses use historical sales data to predict future sales and adjust their inventory and marketing strategies accordingly. By understanding seasonal trends and cyclic patterns, companies can better prepare for peak demand periods and manage stock levels efficiently.
Customer Behavior Analysis: Companies analyze customer data to identify seasonal trends and tailor their marketing efforts to match customer preferences. This helps in creating targeted marketing campaigns and enhancing customer satisfaction.
Financial Market Analysis: Investors and analysts study stock price movements to make informed investment decisions and manage risks. Time series analysis helps in identifying market trends, volatility, and potential investment opportunities.
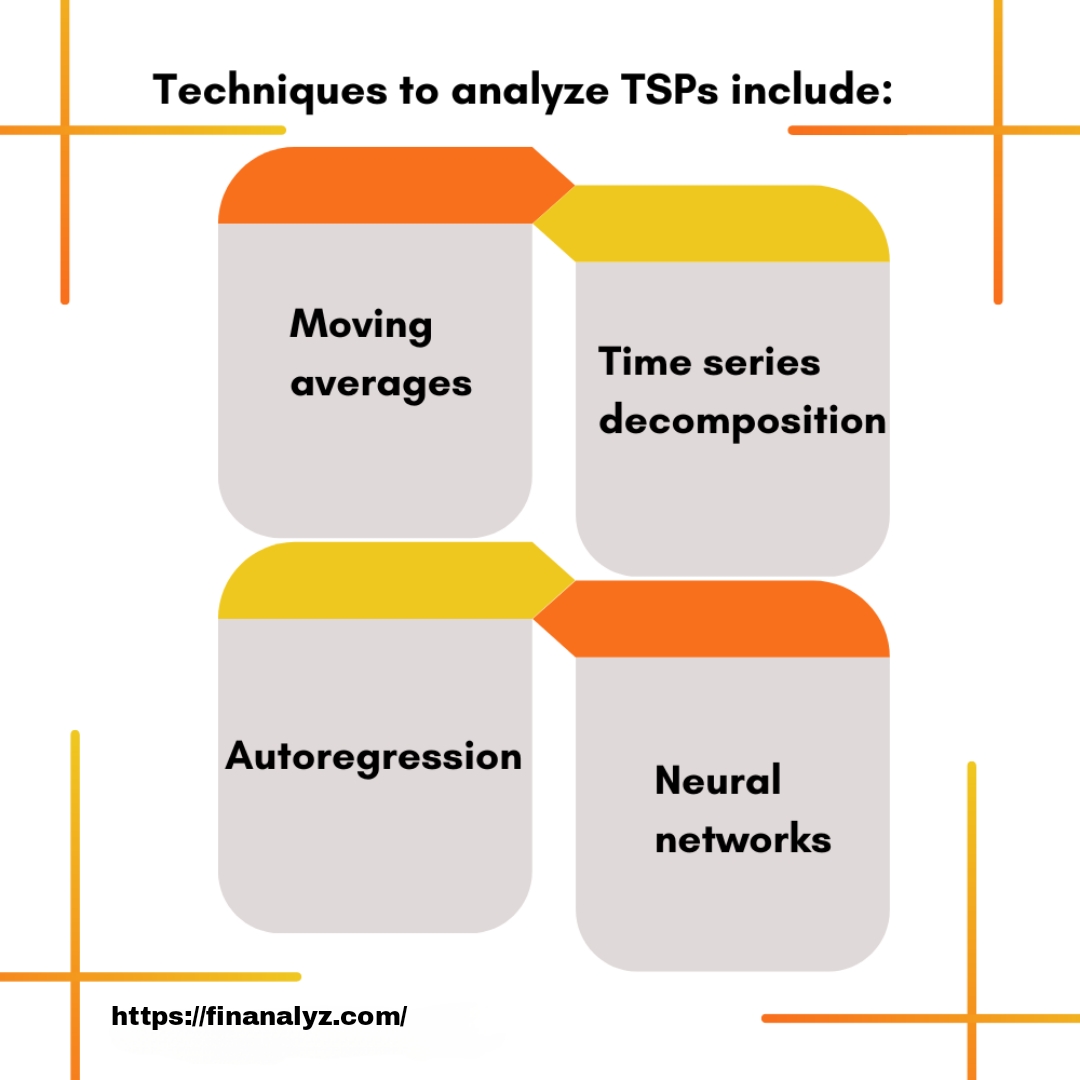
Tools and Techniques for Analyzing TSPs
Moving Averages
Moving averages involve calculating the average value of a series of data points over a specified period, such as a week or a month. This method helps smooth out fluctuations in the data, making it easier to identify underlying trends and patterns. Moving averages are particularly useful in financial market analysis and sales forecasting. By using moving averages, analysts can filter out short-term noise and focus on long-term trends.
Time Series Decomposition
Time series decomposition breaks down a time series into its component parts: trend, seasonality, and residual values. This technique allows analysts to identify and isolate different patterns in the data. For instance, a retail business might use decomposition to separate seasonal effects from long-term growth trends in sales data. Decomposition helps in understanding the individual contributions of trend, seasonal, and irregular components to the overall time series.
Autoregression
Autoregression is a statistical method that uses past values of a time series to predict future values. By analyzing the relationship between current and past data points, autoregression models can forecast future trends and detect anomalies. This method is widely used in economic forecasting and demand planning. Autoregressive models can capture dependencies in the data and provide insights into the underlying dynamics of the time series.
Neural Networks
Neural networks, a type of machine learning algorithm, can identify complex patterns in time series data. These algorithms can handle large datasets and capture non-linear relationships, making them suitable for analyzing patterns that change over time or are influenced by multiple variables. Neural networks are used in various applications, including weather forecasting and financial market prediction. They can learn from historical data and improve prediction accuracy by adapting to new patterns.
Case Studies: Practical Uses of TSPs
In this section, we will explore real-world examples of how TSPs are applied in different industries:
Retail: A major retailer uses time series analysis to optimize inventory management and reduce stockouts during peak seasons. By analyzing past sales data, the retailer can forecast demand and adjust inventory levels to meet customer needs.
Healthcare: Hospitals leverage time series data to predict patient admission rates and allocate resources efficiently. By understanding admission patterns, hospitals can optimize staffing levels and manage patient flow effectively.
Finance: Investment firms use TSPs to develop trading strategies and manage portfolio risks. Time series analysis helps in identifying market trends, volatility, and potential investment opportunities. By analyzing historical price data, investment firms can make informed decisions and enhance their trading strategies.
Leveraging FinAnalyz for Personal Finance Management
FinAnalyz is here to get all your financial accounts under one roof. Fintech companies, personal finance/investment management organizations, and product companies focusing on customer digital experience, analytics, and research can leverage FinAnalyz as a cost-effective solution for personal finance management. By consolidating financial data and providing advanced analytics, FinAnalyz helps users make informed decisions about their personal finances. FinAnalyz offers features like budget tracking, expense analysis, and investment monitoring, empowering users to achieve their financial goals.
FAQs
What are Time Series Patterns (TSPs) in data analytics?
Answer: Time series patterns refer to trends or patterns observed in data that is recorded at regular intervals over time. These patterns can help analysts identify trends, seasonality, and cyclic behaviors in various types of data, such as stock prices, weather data, and website traffic.
Why is time series data important?
Answer: Time series data is important because it allows analysts to track changes over time, identify trends, and observe seasonal variations. This information is crucial for making informed decisions, forecasting future trends, and optimizing operations across various industries.
What are some common techniques for analyzing TSPs?
Answer: Common techniques for analyzing TSPs include moving averages, time series decomposition, autoregression, and neural networks. These methods help smooth out data fluctuations, break down data into component parts, predict future values, and identify complex patterns, respectively.
How can businesses use TSPs to their advantage?
Answer: Businesses can use TSPs to forecast sales, optimize inventory management, understand customer behavior, and develop trading strategies. By analyzing historical data, businesses can make data-driven decisions, improve efficiency, and enhance customer satisfaction.
What is the difference between moving averages and autoregression?
Answer: Moving averages involve calculating the average value of a series of data points over a specified period to smooth out short-term fluctuations and highlight longer-term trends. Autoregression, on the other hand, uses past values of a time series to predict future values, capturing the dependencies and relationships within the data.
How do neural networks help in analyzing time series data?
Answer: Neural networks, a type of machine learning algorithm, can identify complex and non-linear patterns in time series data. They are capable of handling large datasets and can adapt to changing patterns over time, making them effective for tasks such as weather forecasting and financial market prediction.
What role does FinAnalyz play in personal finance management?
Answer: FinAnalyz helps users consolidate all their financial accounts and provides advanced analytics for personal finance management. It offers features like budget tracking, expense analysis, and investment monitoring, empowering users to make informed financial decisions and achieve their financial goals.
Conclusion
Overall, TSPs are a powerful tool for data analysts and can be used to inform a wide range of business decisions. By identifying trends and patterns in time series data, analysts can make more accurate predictions and better understand the factors driving changes in their data. Whether you are in retail, finance, healthcare, or any other industry, leveraging TSPs can provide valuable insights and enhance your decision-making processes. Embracing TSPs can lead to improved operational efficiency, strategic planning, and ultimately, better business outcomes.